Copy link
Type I and Type II Errors
Last updated: 01/07/2025
Key Points
- Type I errors result in false positives, whereas Type II errors result in false negatives. Both impact clinical decisions and patient outcomes.
- Minimizing these errors is crucial to avoid unnecessary treatments and ensure that beneficial interventions are not overlooked.
- Techniques like Receiver Operating Characteristic (ROC) curves help to visualize and balance the trade-off between Type I and Type II errors, guiding more accurate decision-making.
Statistical Testing
- Statistical inference helps us draw conclusions about a population by analyzing a population sample.1
- However, complete population data is often inaccessible, which requires clinicians to make estimations and predictions.1,2
- As a result, there is always a risk of drawing incorrect conclusions from the sample data.1,2
- At the core of scientific inquiry lies hypothesis testing.2
- This is a structured approach to determining the validity of assumptions using statistical analysis.2
The foundation of hypothesis testing relies on the following:
- Null hypothesis (H₀): Assumption that there is no difference/effect between groups.1
- For example, a new anesthetic does not reduce recovery time compared to standard treatment.
- Alternative hypothesis (H₁): Assumption that there is a difference/effect between groups.1
- For example, a new anesthetic significantly reduces recovery time compared to standard treatment.
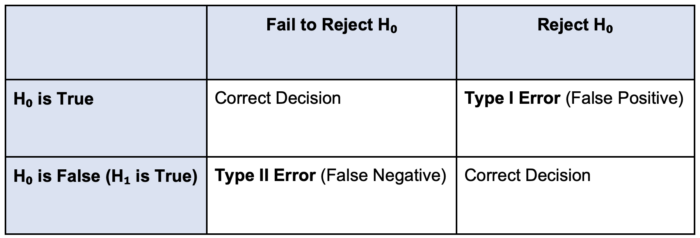
- When testing a hypothesis, clinicians must collect data and measure the extent to which that data supports or does not support the null hypothesis1 (Table 1).
- If the data shows results similar to what is expected under H₀, we fail to reject H₀.1,2
- If the data shows results with a significant difference from H₀, we reject H₀ in favor of H₁.1,2
- Hypothesis testing is not foolproof, and errors can still occur.1
- These errors fall into two main categories:
- Type I Error (False Positive) (α)
- Type II Error (False Negative) (β)

Table 1. Visualizing Type I and Type II errors
Type I Errors
Type I Error (False Positive) (α)
- Occurs when we incorrectly reject the null hypothesis (H₀), concluding that an effect/difference exists when it does not.1
- For example, a study might indicate that a new anesthetic reduces recovery time, but the observed difference is due to random chance rather than the drug’s effect.
Why Does It Matter?
- Unnecessary interventions: Patients might receive treatments that do not help or could potentially add risks.3
- Wasted resources: Hospitals may spend time and money on ineffective treatments.3
- Misleading guidelines: Incorrect findings may influence medical guidelines, delaying better solutions for care.3
How to Reduce Type I Errors (False Positives) (α)?
- Use confidence intervals (CI)
- Instead of relying solely on p-values, looking at CI reveals how much clinicians trust the results and how significant the effect might be.4
- This gives a clearer picture than just “significant” or “not significant” based on p-values.
- Adjust for multiple comparisons:
- If a study tests multiple outcomes at once, the number of false positives increases.5
- Using corrections like Bonferroni adjustments helps to reduce this risk.5 The Bonferroni method adjusts the significance level by dividing the desired alpha (e.g., 0.05) by the number of comparisons made:
- If a study tests multiple outcomes at once, the number of false positives increases.5

-
-
- Where N is the number of tests.
- For example, a study compares four different anesthetics in reducing post-operative nausea. If the standard alpha is 0.05 and four comparisons are made, the Bonferroni correction adjusts the significance threshold:
-

-
-
- This lowers the significance threshold, meaning a p-value below 0.0125 is considered statistically significant after four comparisons.
-
- Report effect sizes:
- Effect size shows how big the difference is between treatments. This tells us if the difference is clinically significant and not only statistically significant.2
- Blinding:
- Blinding prevents bias from affecting the results.4
- Larger studies:
- Repeating the study with more patients helps confirm if the results were real or by chance, providing more substantial evidence and reducing false positives.4
Type II Errors
Type II Error (False Negative) (β)
- It occurs when we fail to reject the null hypothesis, overlooking a true effect/difference that exists.1
- For example, a study might conclude that a new anesthetic has no effect, even though it reduces recovery time.
Why It Matters?
- Delays in beneficial treatments:
- Valuable treatments might be overlooked or delayed, resulting in suboptimal care.6
- Impact on patient outcomes:
- Patients can miss out on interventions that improve safety, reduce pain, or shorten recovery times.6
- Small anesthesiology trials may miss subtle but real effects in patient recovery or pain relief.4
How to Reduce Type II Errors (False Negatives)?
- Increase Sample Size and Study Power:
- Small studies often miss real effects.4
- Conducting a power analysis helps to ensure that the study includes enough participants to detect meaningful differences.4
- A study with low power increases the risk of Type II errors.
- Small studies often miss real effects.4

-
-
- Where β is the probability of a Type II error.
- Increasing the sample size is the most effective way to boost power, helping to ensure that smaller but clinically important effects are detected.4
-
- Extend study duration:
- Short trials may not capture long-term benefits.4
- Following patients longer helps to detect delayed improvements.4
- Combine studies (meta-analysis):
- Smaller studies may miss effects, but combining data from multiple studies increases the ability to detect real results.4
Receiver Operating Characteristic (ROC) Curves
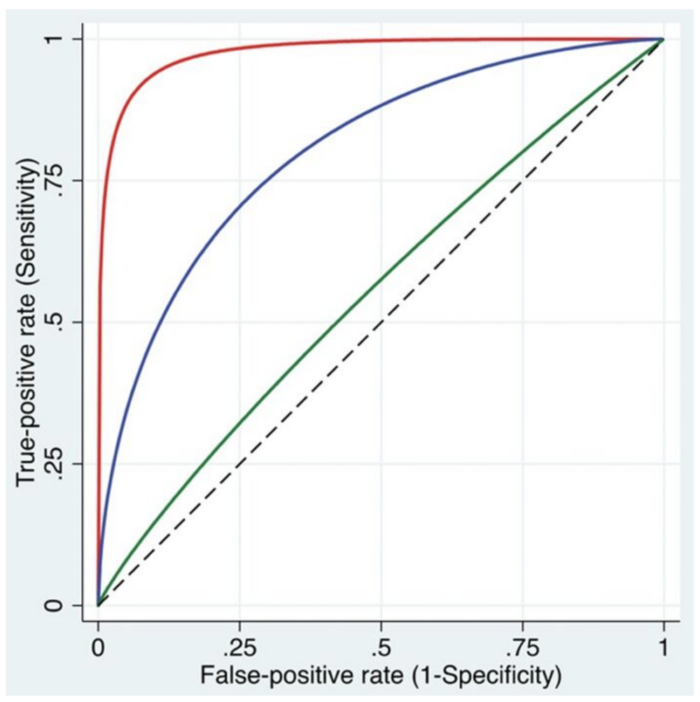
The ROC curve plots True Positive Rate vs. False Positive Rate.7
- It shows how well a test separates true positives from false positives.
- It visualizes the impact of different decision thresholds, which refers to the cut-off point used to classify data (i.e., effect or no effect, disease or no disease).7
- Adjusting the threshold shifts the balance between Type I and II errors.7
- Lower threshold → Fewer Type II errors (high sensitivity), but more Type I errors.
- Higher threshold → Fewer Type I errors (high specificity), but more Type II errors.
- The best performance is near the upper left of the curve.7
AUC (Area Under the Curve)
- AUC = 1 → No errors.
- AUC = 0.5 → Random guessing (equal Type I and II errors).
- A higher AUC means better accuracy and fewer errors.7

Figure 1. The ROC curves illustrate the relationship between the true-positive rate (sensitivity) and the false-positive rate (1 − specificity) across a range of cutoff values. Three curves are shown, representing models with high (red), intermediate (blue), and low (green) discriminative abilities to differentiate between patients with and without the condition. Used with permission from Vetter TR et al. Anesth Analg. 2018.8
References
- Kim HY. Statistical notes for clinical researchers: Type I and type II errors in statistical decision. Restor Dent Endod. 2015;40(3):249-52. PubMed
- Banerjee A, Chitnis UB, Jadhav SL, Bhawalkar JS, Chaudhury S. Hypothesis testing, type I and type II errors. Ind Psychiatry J. 2009;18(2):127-31. PubMed
- Merry AF, Weller J, Mitchell SJ. Improving the quality and safety of patient care in cardiac anesthesia. J Cardiothorac Vasc Anesth. 2014;28(5):1341-51. PubMed
- Bajwa SJ. Basics, common errors, and essentials of statistical tools and techniques in anesthesiology research. J Anaesthesiol Clin Pharmacol. 2015;31(4):547-53. PubMed
- Armstrong RA. When to use the Bonferroni correction. Ophthalmic Physiol Opt. 2014;34(5):502-8. PubMed
- Cummins RO, Hazinski MF. Guidelines based on fear of type II (false-negative) errors. Why we dropped the pulse check for lay rescuers? Resuscitation. 2000;46(1-3):439-42. PubMed
- Nahm FS. Receiver operating characteristic curve: overview and practical use for clinicians. Korean J Anesthesiol. 2022;75(1):25-36. PubMed
- Vetter TR, Schober P, Mascha EJ. Diagnostic testing and decision-making: Beauty is not just in the eye of the beholder. Anesth Analg. 2018;127(4):1085-91. PubMed
Copyright Information

This work is licensed under a Creative Commons Attribution-NonCommercial-NoDerivatives 4.0 International License.