Key Points
- Ventilation basics include tidal volume (~500 mL/breath), ventilation rate (~12 breaths/min), and minute ventilation (~6000 mL/min). Inhalation uses negative pleural pressure, while exhalation occurs via lung and chest wall recoil.
- Dead space refers to air not reaching alveoli (anatomic) or ventilated but nonperfused alveoli (physiologic). Increased dead space reduces effective alveolar ventilation and impacts gas exchange.
- Pulmonary circulation varies by lung zone based on pressure gradients. Hypoxic pulmonary vasoconstriction redirects blood to well-ventilated areas.
- The ventilation-perfusion ratio (~0.8 average) reflects gas exchange efficiency. Mismatches impair oxygenation and help identify respiratory pathologies.
Introduction
- The pulmonary system facilitates gas exchange, bringing oxygen into the bloodstream and carbon dioxide out into the environment.
- Intrinsic lung properties such as diffusion capacity and adequate perfusion of pulmonary acini (alveolar sacs, ducts, and respiratory bronchioles) are necessary for efficient gas exchanges.
- The lungs can redirect blood flow away from poorly ventilated regions and areas with occluded vasculature.
Ventilation Physiology
- Tidal volume (VT) is the volume of air that enters the lung with each breath.2
- Tidal volume is influenced by various factors, such as age and existing pulmonary disease. A healthy adult typically has a tidal volume of about 500 mL.
- Ventilation rate is the number of breaths x minute-1 . Typically, healthy adult respiratory rate is about 12 x min-1 – though pediatric patients have increased rates at baseline.3,4
- Minute ventilation is the product of tidal volume and ventilation rate – denoted in mL x minute-1 (12 x 500 = 6000 mL x min-1).2,4
- Functional residual capacity (FRC) denotes the equilibrium point between the chest wall and the lung. It is the volume of air remaining in the lung after normal expiration.2
- At rest, inhalation is mainly achieved through the synergistic effect of the diaphragm and intercostal muscles that generate greater negative pleural pressure than at FRC (normally -5 cm H2O).1 This new pleural pressure (-7.5 cm H20) expands the lungs, creating a gradient between the environment and intrapulmonary pressure, thereby driving air into the lungs.2,4
- Exhalation is achieved by the natural tendency of the lung and chest wall to recoil. During strenuous breathing, intercostal muscles (particularly internals) and abdominal muscles assist with expiration.2,3
Dead Spaces (Anatomic and Physiologic)
- Not all inspired gas reaches alveoli to participate in gas exchange. About 100 – 150 mL remain in the airways – a quantity termed anatomic dead space.1
- The volume of air that reaches alveoli for gas exchange is termed “alveolar ventilation,” denoted as VA2.
- Thus, anatomic dead space can be quantified by the following formula:


- Anatomic dead space becomes important, particularly in obstructive pathologies that increase it. From rearranging the previous formula to yield:2

It can be appreciated that when all else remains equal, an increase in anatomic dead space ventilation reduces alveolar gas.2
- Physiologic dead space signifies areas of alveoli that do not participate in gas exchange despite proper ventilation.3
- In healthy individuals, anatomic dead space = physiologic dead space. Increased physiologic dead space can be seen in pulmonary vascular and parenchymal lung disease.1,2
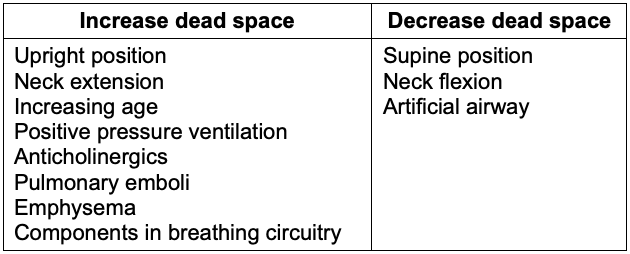
Table 1. Factors that affect dead-space ventilation5
Distribution of Ventilation
- Regardless of positioning, the lungs are not evenly aerated. The right lung receives 53%, and the left lung receives 47%.5
- The lower lung regions are better ventilated than the upper regions due to a gravitationally induced gradient in intrapleural pressure.5
- Pleural pressure increases by 0.25 cm H2O for every centimeter down the lung. This increase in pleural pressure causes a fourfold decrease in alveolar volume from the top of the lung to the bottom (Figure 1).
- The lower intrapleural pressure in the basilar areas of the lungs allows for the alveoli to expand more. Meanwhile, the upper lung alveoli are near maximally inflated and thus less compliant.5
- When alveolar volumes are translated to a pressure-volume (compliance) curve, the dependent small alveoli are on the midportion, and the nondependent large alveoli are on the upper portion of the S-shaped compliance curve (Figure 1). Thus, dependent alveoli are relatively compliant (steep slope), whereas nondependent alveoli are relatively noncompliant (flat slope).
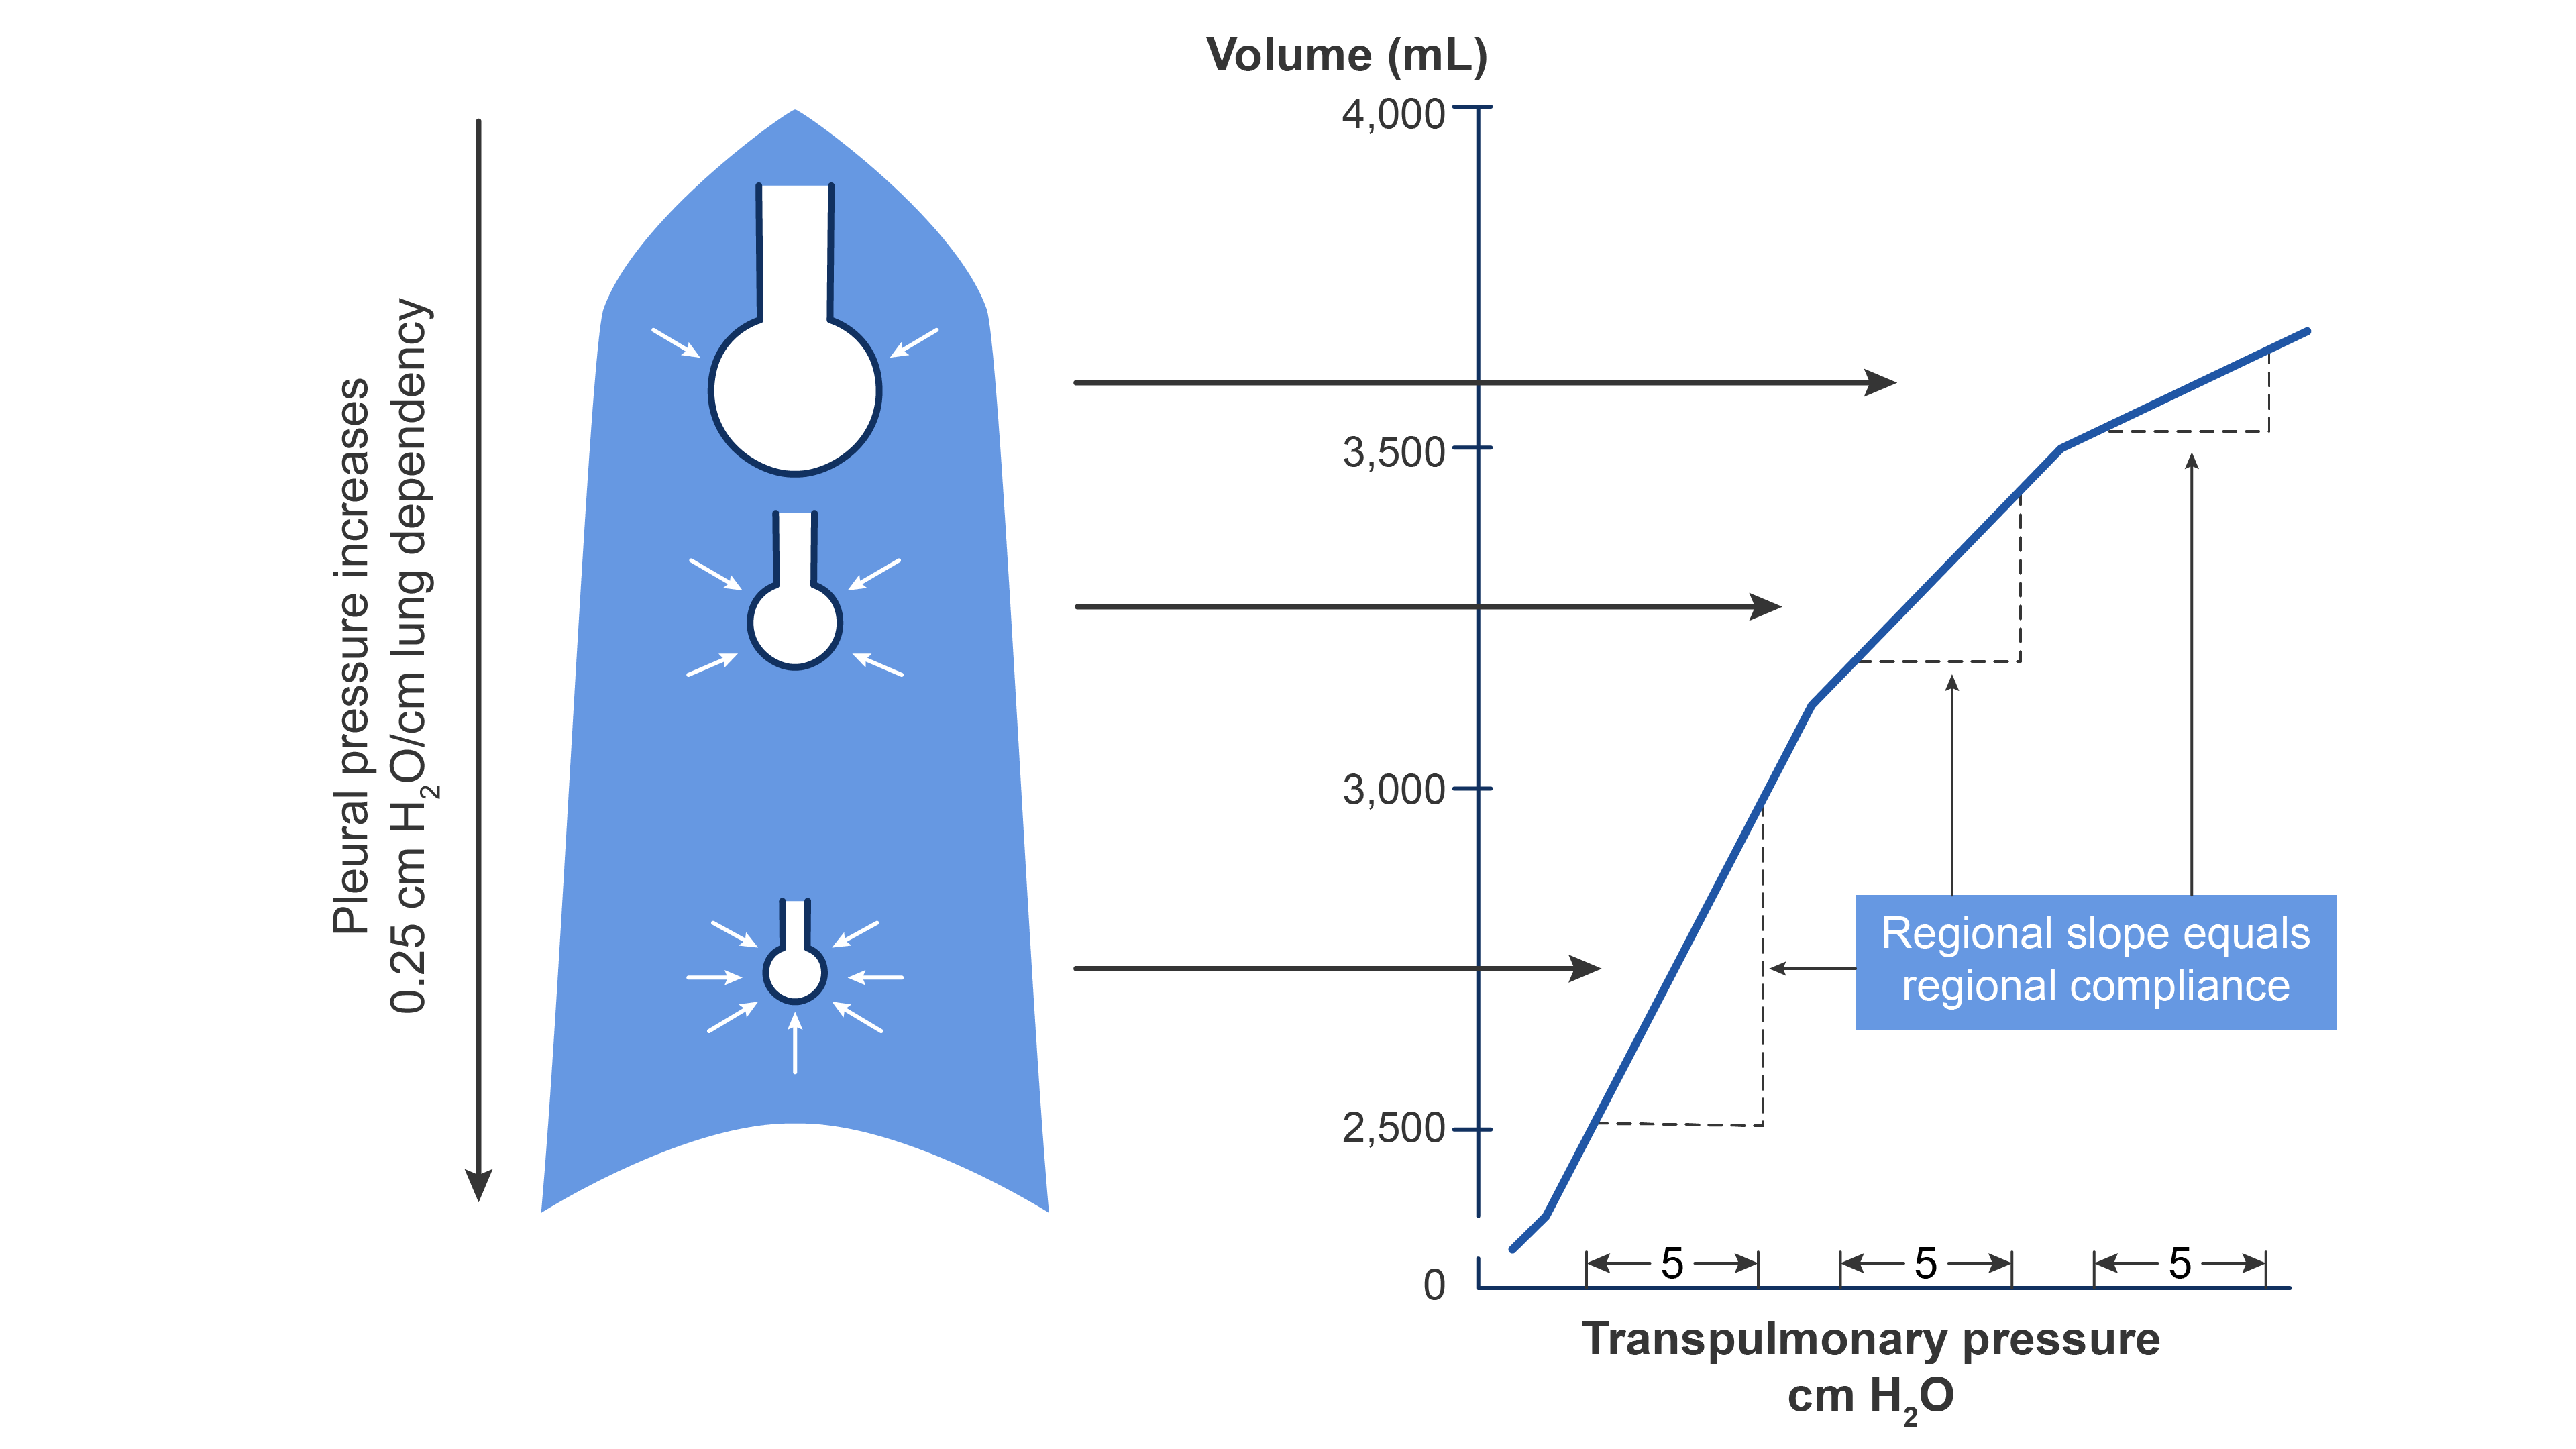
Figure 1. The effect of gravity on alveolar compliance in an upright lung. Redrawn from Wilson WC, Benumof JL. Physiology of the airway. Clinical Gate. 2015. Link
Lung Perfusion
- Pulmonary circulation differs from systemic circulation and is a low-pressure, low-resistance circulation.3,4
- The lungs receive about 5 L/min of blood, but only 70 to 100 mL is in the pulmonary capillaries at any given time, where gas exchange occurs.5
- The blood in the alveolar-capillary membrane forms a thin sheet of about 50 to 100 m² and is one red cell thick.5
- Pulmonary blood volume can be affected by posture, systemic venous constriction, and vasodilation, with the lungs serving as a reservoir for systemic circulation.5
- Whereas systemic tissue hypoxia usually triggers vasodilation to increase perfusion, the lung redirects blood away from areas with poor ventilation and/or oxygen tension towards more oxygenated areas, so-called hypoxic pulmonary vasoconstriction.2
Distribution of Lung Perfusion
- Lung perfusion is not uniform and is mainly driven by the pressure gradient in the pulmonary artery and pulmonary vein as well as by the opposing alveolar pressure (PA).1-3
- Regions of the lung receive differing blood supply and are divided into zones I-IV1 (Figure 2).
- Zone I is anatomically located toward the apex. In zone 1, PA is greater than pulmonary artery pressure (Ppa) and pulmonary venous pressure (Ppv), i.e., PA > Ppa > Ppv. There is no blood flow because the intra-alveolar vessels are collapsed by the compressing PA. Because there is no blood flow, no gas exchange is possible, and the region functions as alveolar dead space. Under normal conditions, little or no zone 1 exists but it can enlarge during positive pressure ventilation.
- Further down the lung in zone 2, blood flow begins when Ppa exceeds PA, but PA exceeds Ppv (Ppa > PA> Ppv). Flow in zone 2 is determined by the Ppa-PA difference and has been likened to an upstream river flowing over a dam.
- Still lower in the lung in zone 3, Ppv becomes positive and exceeds PA (Ppa > Ppv > PA). In zone 3, blood flow is determined by the Ppa -Ppv difference, which is constant in this portion of the lung.
- Finally, in zone 4, pulmonary interstitial pressure (PISF) becomes positive and exceeds both Ppv and PA. Therefore, blood flow in zone 4 is determined by the Ppa-PISF difference. Zone 4 is the most dependent part of the lung, where atelectasis and interstitial pulmonary edema occur.
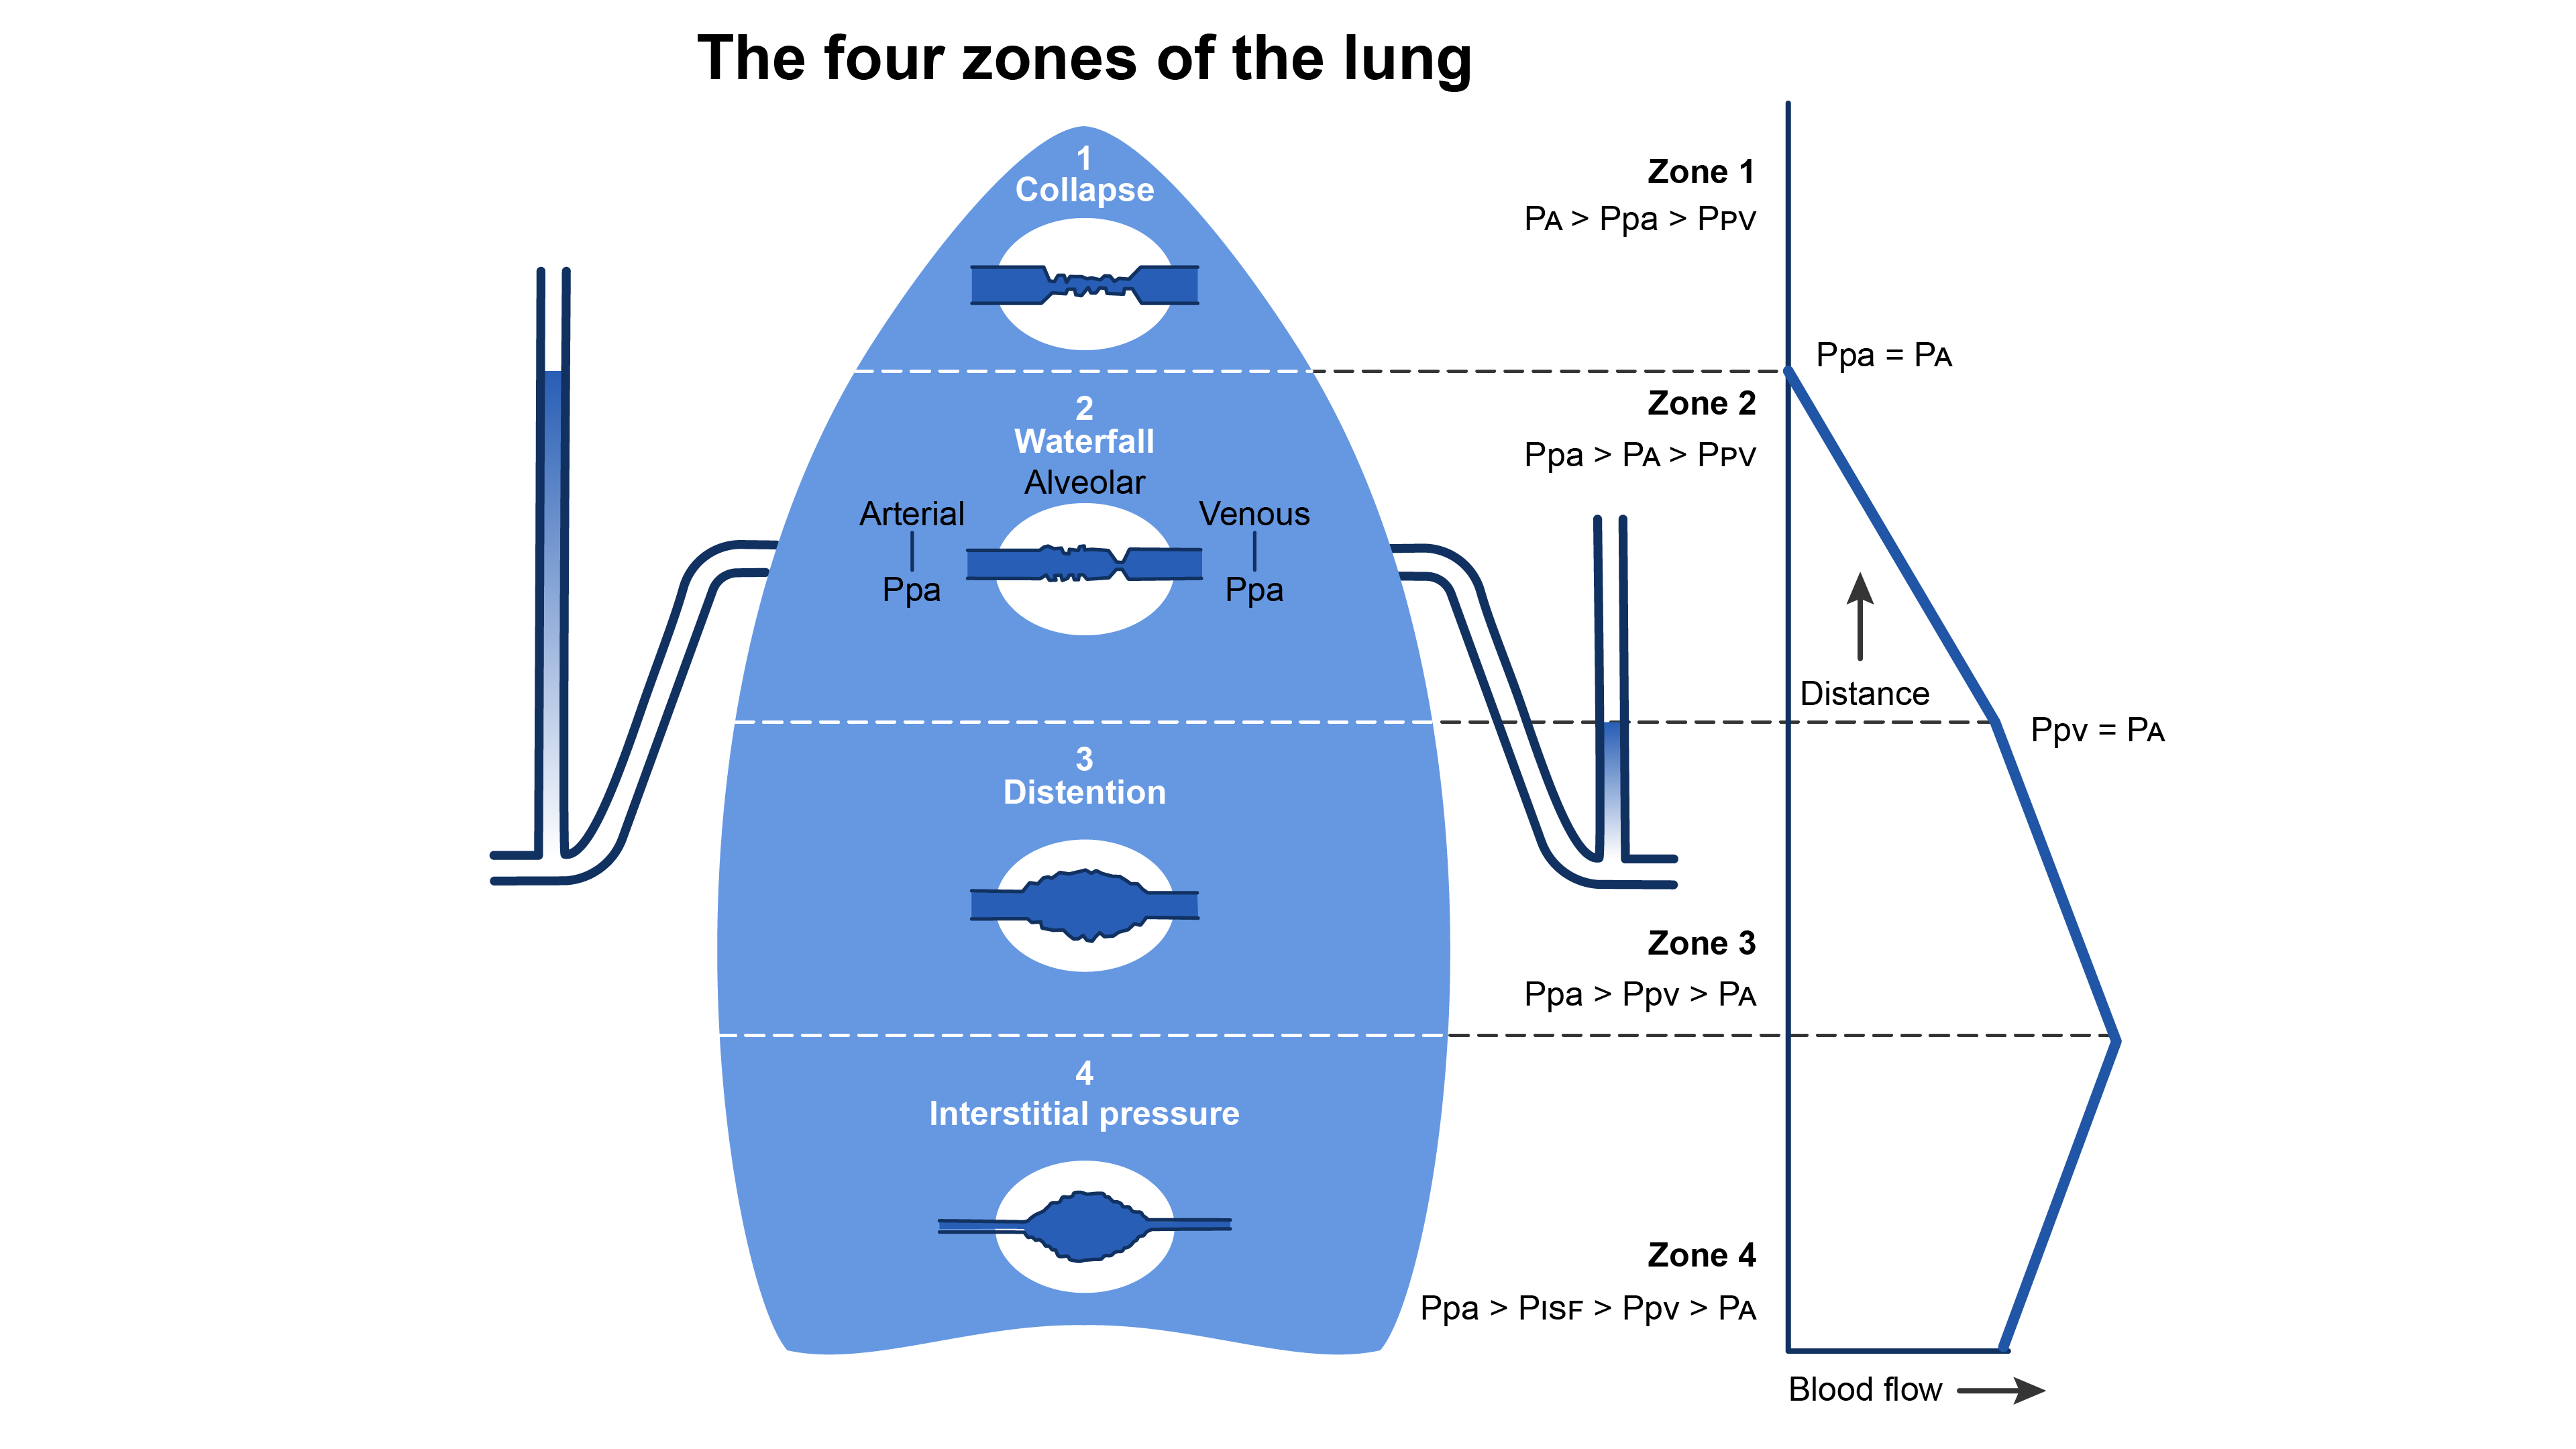
Figure 2. Distribution of blood flow in the upright lung. Redrawn from Wilson WC, Benumof JL. Physiology of the airway. Clinical Gate. 2015. Link
V/Q Ratio
- V/Q is the ratio between alveolar ventilation (V) and perfusion (Q).1,2
- Drastic V/Q changes imply that gas exchange is less than ideal.3
- Since alveolar ventilation is normally about 4 L/min, and pulmonary perfusion is about 5 L/min, the average lung V/Q ratio is 0.8. The V/Q ratio normally ranges between 0.3 and 3.0 in the different lung zones.2
- V/Q ratio is highest in zone I (~ 3) due to decreased perfusion and comparably lower in zone III (~0.6)3 (Figure 3).
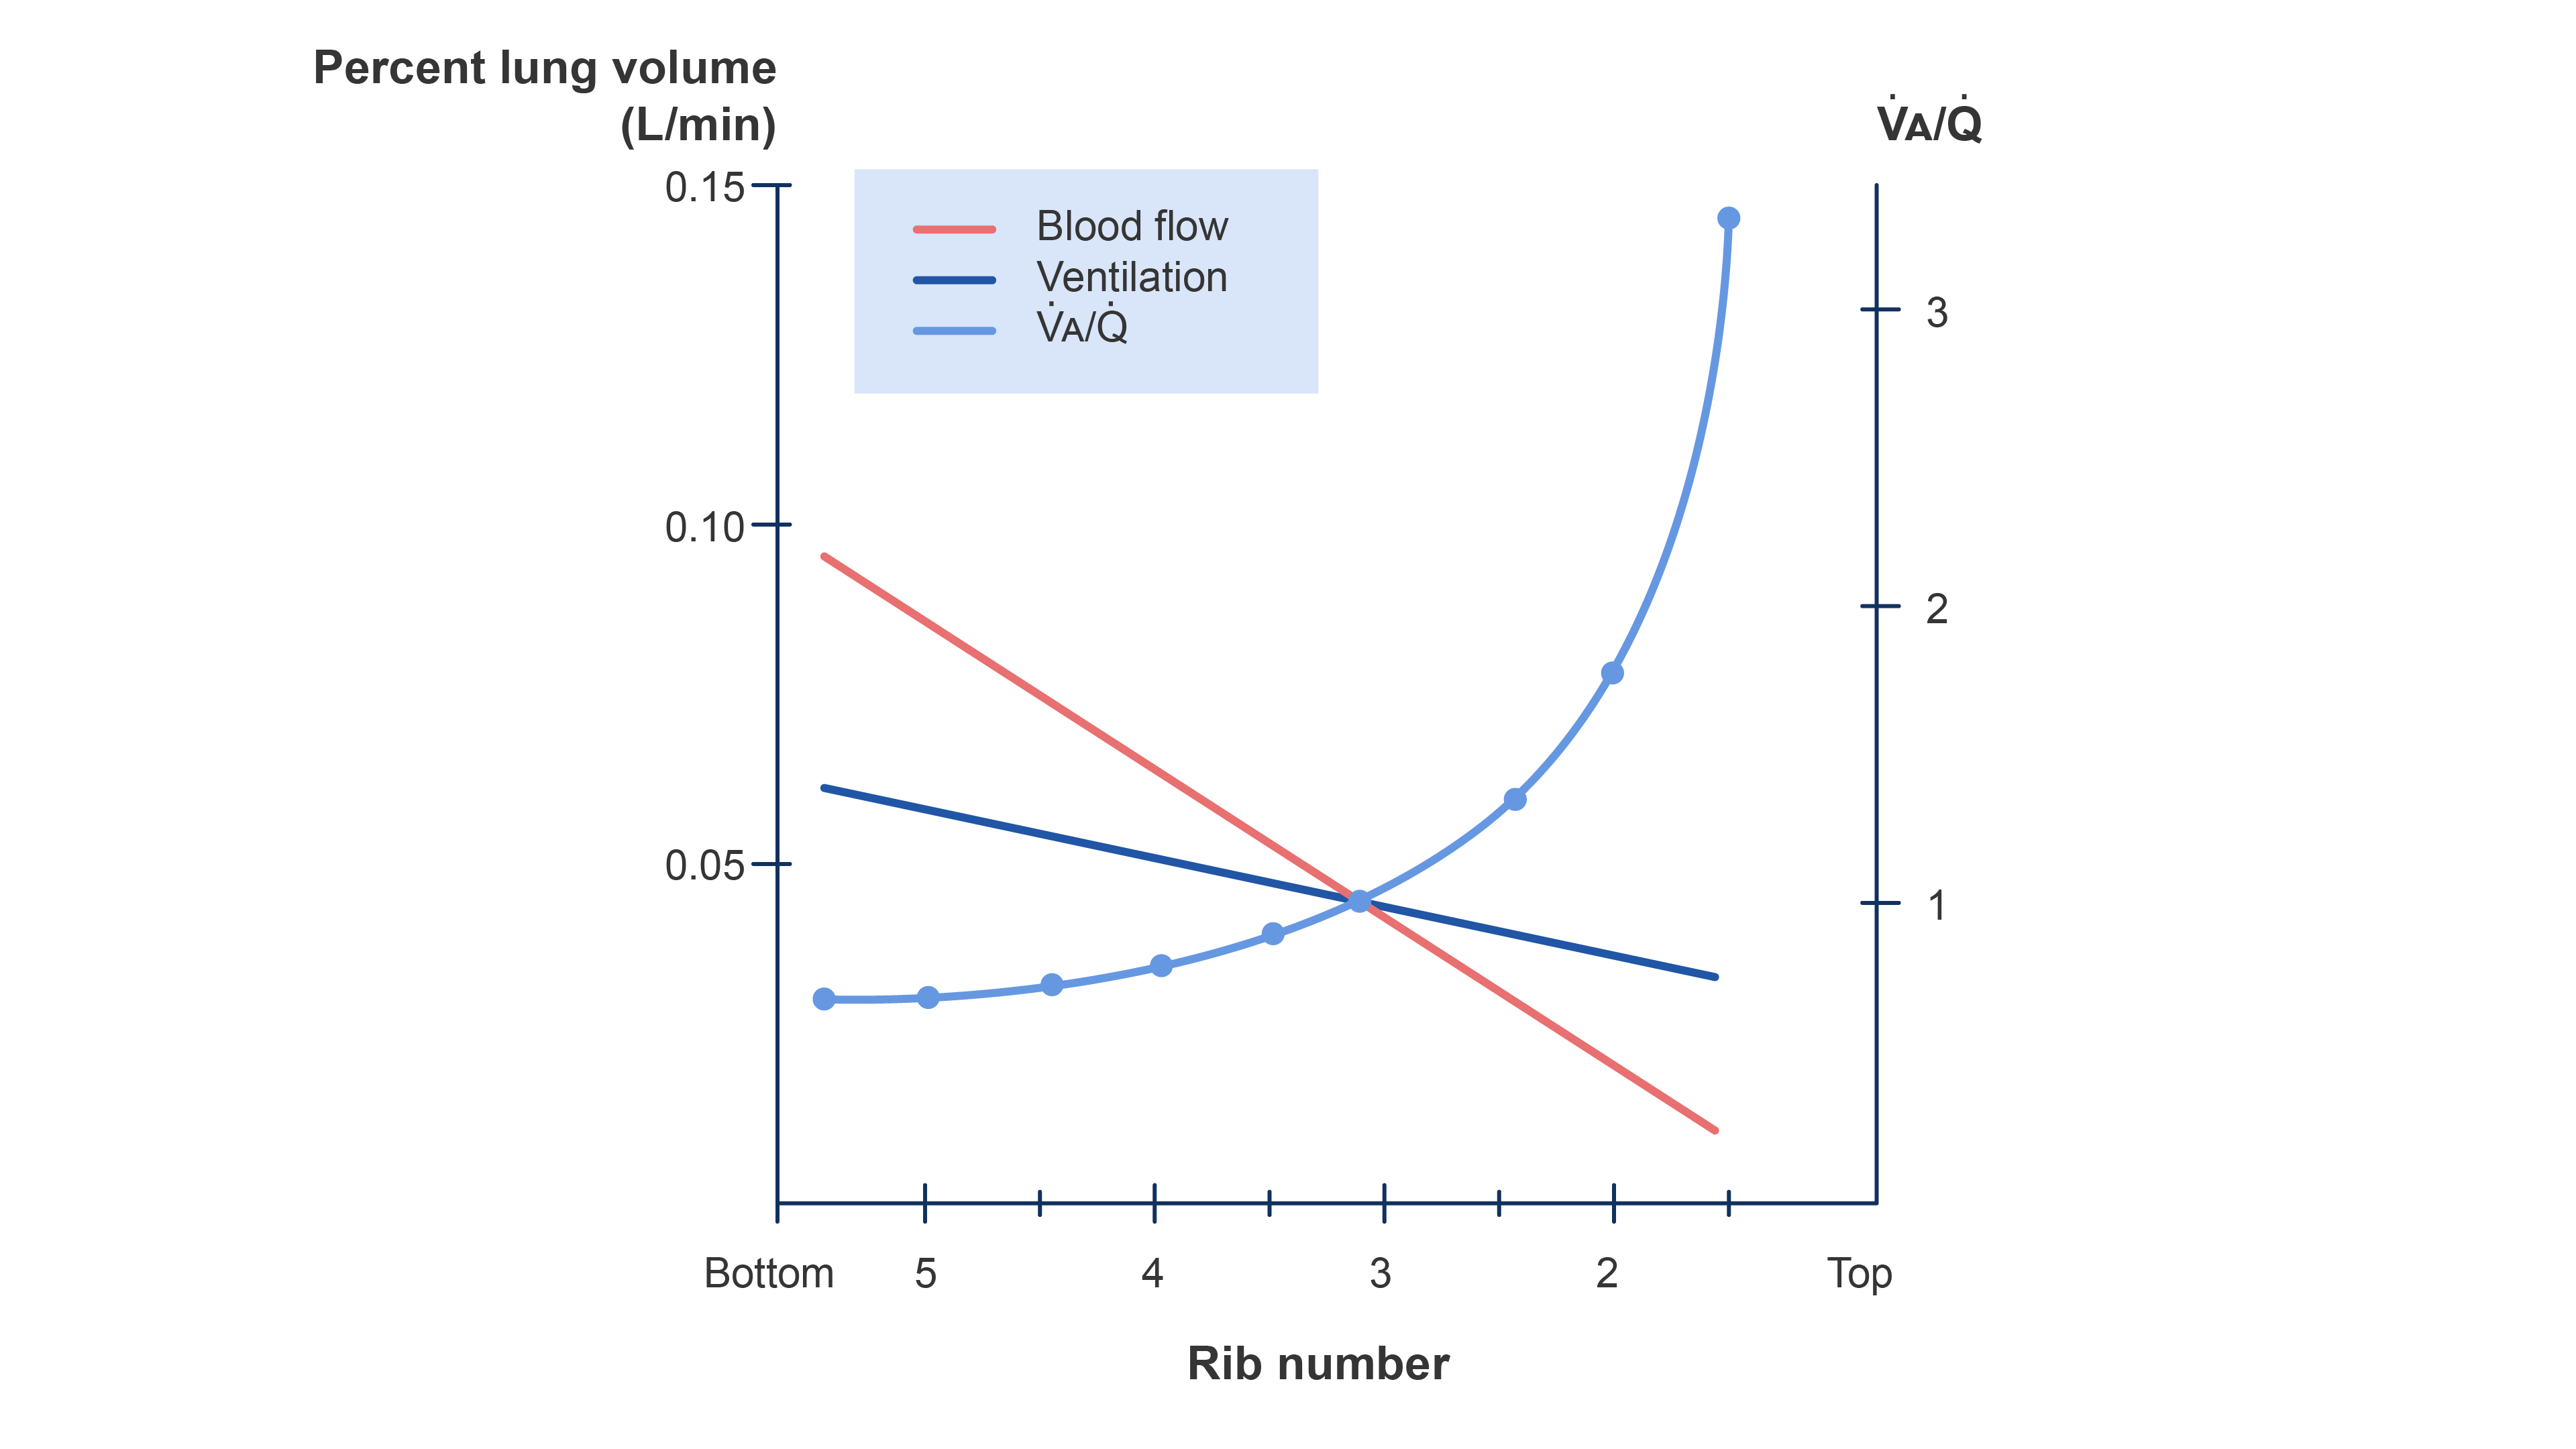
Figure 3. Distribution of ventilation and blood flow and the V/Q ratio in a normal upright lung. Redrawn from Wilson WC, Benumof JL. Physiology of the airway. Clinical Gate. 2015. Link
V/Q Mismatch
- Physiologic dead spaces are areas where perfusion does not occur and ventilation is wasted; thus, V/Q ratios approach infinity. Clinically, a pulmonary embolism exemplifies this phenomenon.1
- High V/Q is present in areas with reduced blood flow. Nonetheless, perfusion does occur, unlike in dead space.1
- Low V/Q is present in areas with poor ventilation relative to perfusion.1,2,3
Shunts
- Right-to-left shunts occur when venous blood is returned to the systemic arterial circulation, bypassing a ventilated alveolus. In this instance, the V/Q ratio approaches 0.2
- This results in dilution of the O2 content on the arterial side.5
- This can be exemplified by airway obstruction or cardiac right-to-left shunt (e.g., Eisenmenger Syndrome).2
- The resultant hypoxemia is poorly responsive to supplemental 100% oxygen and, thus, a useful diagnostic test.1,2
- When deoxygenated blood mixes with pulmonary end-capillary blood, it reduces the overall O2 tension.5
- The amount of venous blood that would have to be mixed with pulmonary end-capillary blood to account for the difference in O2 tension is known as venous admixture.5
- Under normal physiology, the venous admixture is less than 5% and is attributed to bronchial circulation, Thebesian venous drainage, and areas of the lung with very low V/Q ratios.5
- The alveolar-to-arterial gradient (A-a gradient) is the difference between the O2 partial pressure in the alveolus and artery.5
- The A-a gradient is proportional to V/Q mismatch and right-to-left shunts but inversely proportional to venous O2 tension.5
- Lung gas exchange can be oversimplified into the interaction between three key components: dead-space ventilation, the alveolar-capillary membrane, and shunting1,5 (Figure 4).
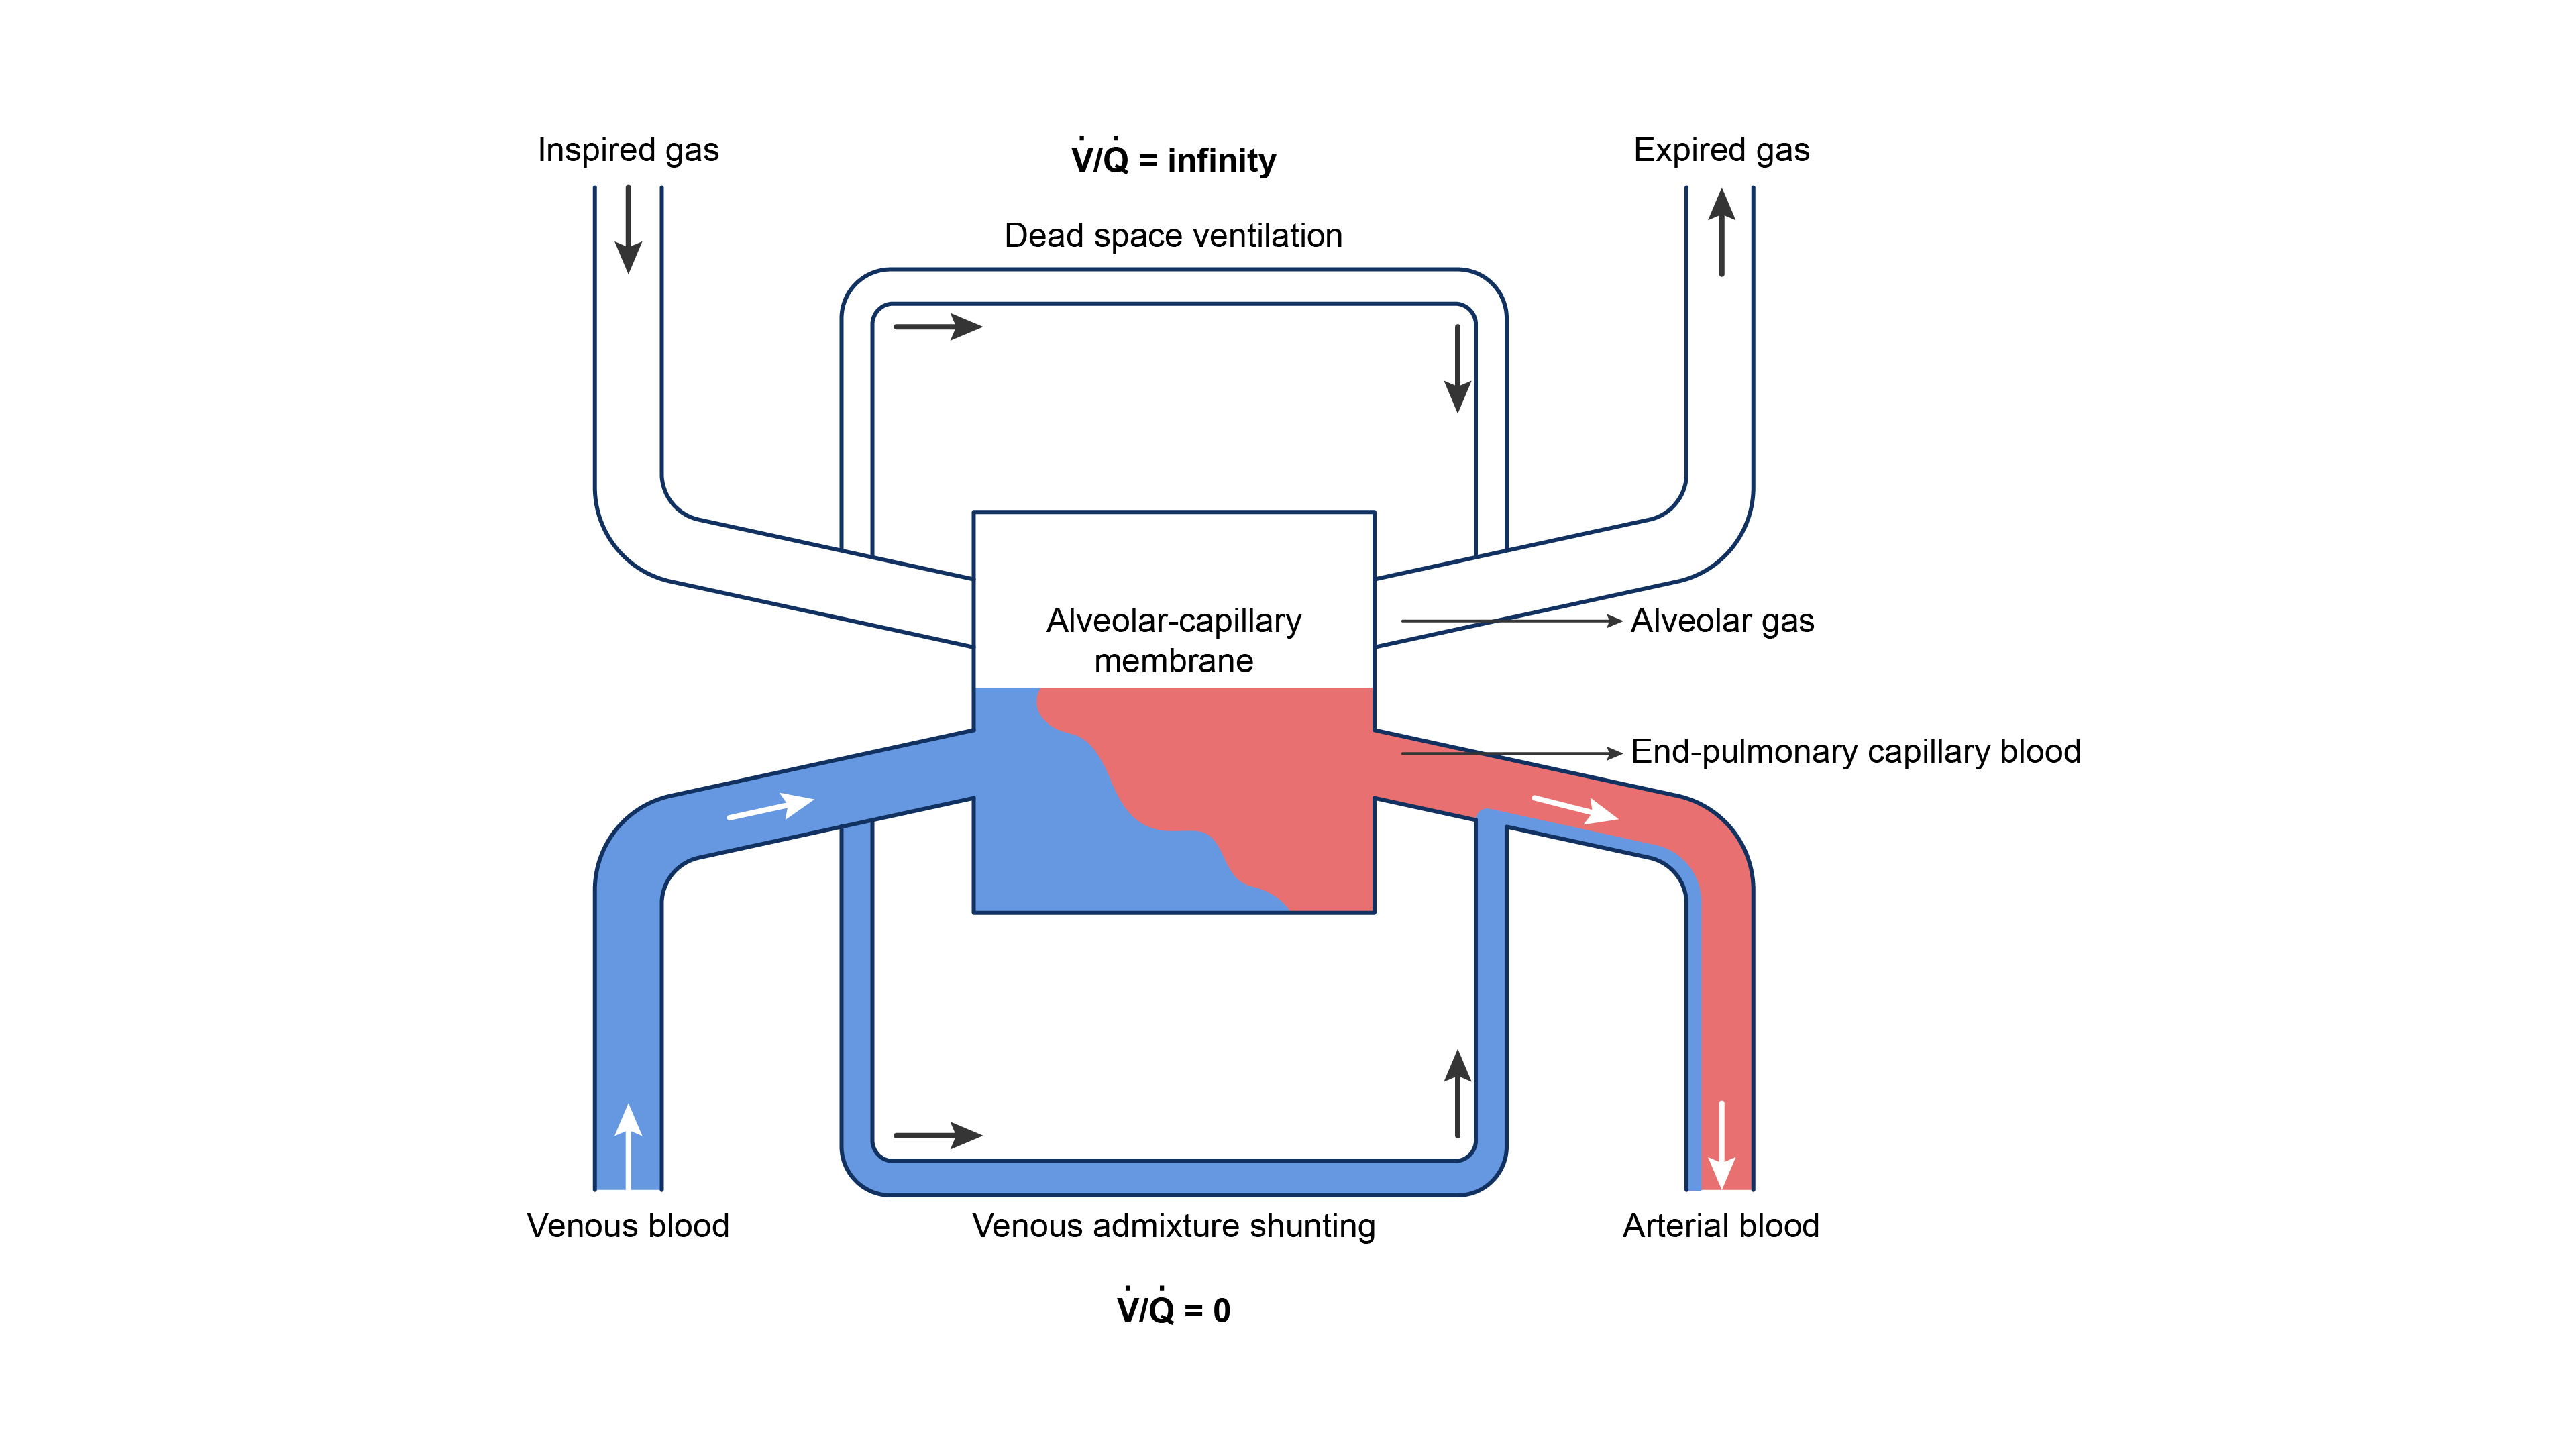
Figure 4. Three-compartment model of gas exchange in the lungs. Redrawn from Lumb A. Nunn’s Applied Respiratory Physiology, St. Louis, MO; Elsevier, 2017.
Effects of Anesthesia on Gas Exchange
- Abnormalities in gas exchange during anesthesia are common, including increased dead space, hypoventilation, and increased intrapulmonary shunting.5
- Alveolar dead space is increased in controlled ventilation but may also occur during spontaneous ventilation.5
- General anesthesia often increases venous admixture by 5 to 10%, primarily due to atelectasis and airway collapse in dependent lung areas (Zone IV).5
- Older adult patients tend to experience the largest increase in admixture.5
- Positive end-expiratory pressure (PEEP) is effective in reducing venous admixture, therefore offsetting hypoxemia caused by general anesthesia.5
- Typically, supplying O2 concentrations of 30 to 40% tends to prevent hypoxemia, indicating that anesthesia may increase a relative shunt.5
References
- Gropper MA. Respiratory Physiology and Pathophysiology. In: Gropper MA, ed. Miller’s Anesthesia. Vol. I, Sec. II. 9th ed. Philadelphia, PA: Elsevier; 2020: 1116-1244
- West JB, Luks AM. West's Respiratory Physiology: The Essentials. 11th ed. Philadelphia, PA: Wolters Kluwer; 2022.
- Costanzo LS. Respiratory Physiology. In: Costanzo LS. Physiology. 7th ed. Philadelphia; Elsevier; 2022:189-243.
- Brinkman JE, Sharma S. Physiology, Pulmonary. In: StatPearls (Internet). Treasure Island, FL. StatPearls Publishing; 2024. Accessed November 4, 2024. Link Link
- Butterworth JF, Mackey DC, Wasnick JD. Respiratory Physiology & Anesthesia. In: Butterworth JF, Mackey DC, Wasnick JD, eds. Morgan & Mikhail’s Clinical Anesthesiology. 7th ed. McGraw-Hill LLC; 2022: 908-981.
Copyright Information

This work is licensed under a Creative Commons Attribution-NonCommercial-NoDerivatives 4.0 International License.