Copy link
Cardiac Cycle and Electrocardiogram
Last updated: 12/17/2024
Key Points
- The cardiac cycle is an intricate balance of electrical and mechanical events.
- The cardiac impulse originates in the sinoatrial node, which is considered the pacemaker of the heart.
- Cardiac action potentials differ from action potentials in muscles and nerves. Cardiac action potentials are initiated by voltage-gated sodium channels (spike) and maintained by voltage-gated calcium channels (plateau).
Heart Rate and Impulse Propagation
- Heart rate (HR) is generated via electrical impulses transmitted throughout the heart.1
- Cardiac action potentials are spontaneously generated in the sinoatrial (SA) node located at the posterior junction of the right atrium and the superior vena cava. The SA node is considered the pacemaker of the heart.1
- The action potentials then move to the atrioventricular (AV) node, located in the septal wall of the right atrium.1
- While the impulses generated at the SA node are rapidly conducted across the right atrium, there is a slight delay at the AV node because of the slowly conducting small fibers within the AV node.1
- From the AV node, the cardiac impulse is conducted to the bundle of His, a specialized group of fibers in the interventricular septum, before dividing into left and right bundle branches to form the complex network of Purkinje fibers that depolarize the remainder of the myocardium1 (Figure 1).
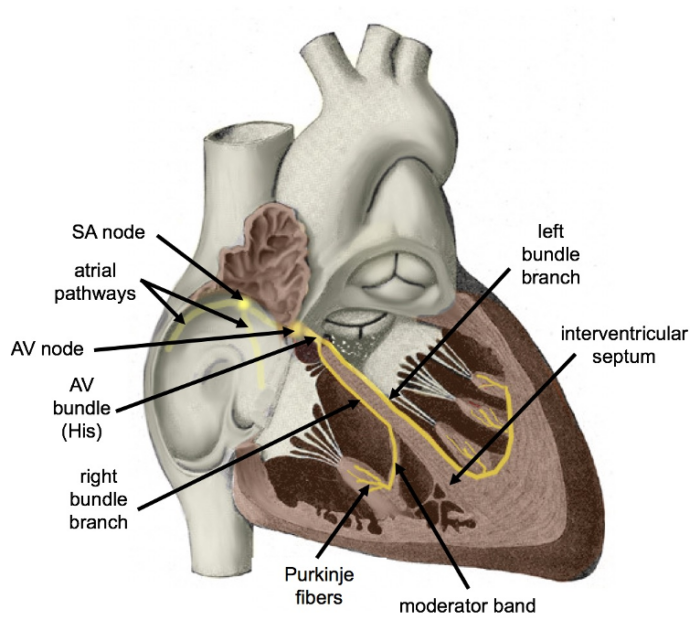
Figure 1. Diagram of the cardiac conduction system. Colorized version of original artwork by Henry VanDyke Carter published in Gray's Anatomy by Henry Gray. Cypressvine. 2019. Accessed on 11/27/2024. Link
Clinical Implications
- Heart rate is influenced by the frequency of depolarizations in the SA node. Autonomic influence, both sympathetic and parasympathetic, can change SA node depolarization frequency and heart rate. Sympathetic input increases heart rate, while parasympathetic input decreases HR.1
- Potent inhaled anesthetics depress SA node automaticity. These agents only have modest direct effects on the AV node, prolonging conduction time. This explains the occurrence of junctional tachycardia when an anticholinergic is administered for sinus bradycardia during inhalational anesthesia. This results from junctional pacemakers being accelerated more than those in the SA node.2
- Opioids, particularly fentanyl and sufentanil, can depress cardiac conduction, increase AV conduction delay, and prolong the duration of Purkinje fiber action potentials.2
- Among the local anesthetics, lidocaine at high concentrations can depress the SA node and cardiac conduction. Bupivacaine, and to a lesser degree, ropivacaine, at high concentrations, can cause profound sinus bradycardia, sinus node arrest, and ventricular arrhythmias. Bupivacaine preferentially binds to open or inactivated sodium channels and dissociates from them more slowly.2
Electrophysiology and Ion Channels
- Cardiac action potentials differ from the action potentials in skeletal muscles and nerves. In skeletal muscles and nerves, the action potential is initiated by the opening of voltage-gated sodium channels. In cardiac muscle, the action potential is initiated by voltage-gated sodium channels (spike) and maintained primarily by voltage-gated calcium channels (plateau).2
- The contours of the cardiac action potentials differ in different parts of the heart. In cardiac cells, depolarization is initiated by voltage-gated sodium channels that briefly open and close. In pacemaker cells, depolarization is initiated by voltage-gated calcium channels rather than by sodium channels.2
SA Node (Figure 2)
- Initial Depolarization (Phase 4): The ion channels responsible for SA node action begin with spontaneous depolarization of a mixed sodium influx-potassium outflux channel, also called “funny channels.”1 The slow infusion of sodium through hyperpolarization-activated cyclic nucleotide-gated (HCN) channels makes the membrane potential to become progressively less negative.
- Upstroke (Phase 0): After the membrane potential reaches a threshold of -40mV, voltage-gated L-type calcium channels rapidly open, allowing an influx of calcium and resulting in strong upstroke and positive membrane potential.1
- Repolarization and threshold (Phase 3): Voltage-gated potassium channels open, allowing K+ to escape the cell and repolarize the membrane. The membrane eventually hyperpolarizes due to increased potassium release and returns to the threshold via funny channel activity.1
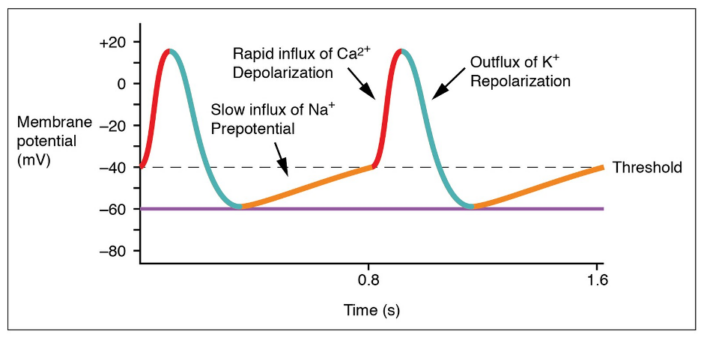
Figure 2. SA node tracing. Anatomy & Physiology, Connexions Web site. OpenStax, 2013. Accessed 11/27/2024. Link
Ventricular Myocardium (Figure 3)
- Resting (Phase 4): Resting potential is determined by efflux of potassium through potassium channels.3
- Depolarization (Phase 0): Action potentials from the SA node reach the membrane via the conduction system, causing voltage-gated sodium channels to open. This allows an influx of sodium into the myocyte, causing depolarization and myocardial contraction.3
- Opening of Potassium Channels (Phase 1): Voltage-gated potassium and chloride channels open in response to the depolarized membrane, causing a brief repolarization.3
- Plateau (Phase 2): Voltage-gated L-type calcium channels open slowly after being depolarized, allowing calcium ions to enter the cell and maintain a balanced depolarized state with the effluxing potassium ions to allow for sustained contraction.3
- Repolarization (Phase 3): Calcium channels close, while potassium channels remain open. The cell then repolarizes back to resting potential via efflux of potassium ions.3
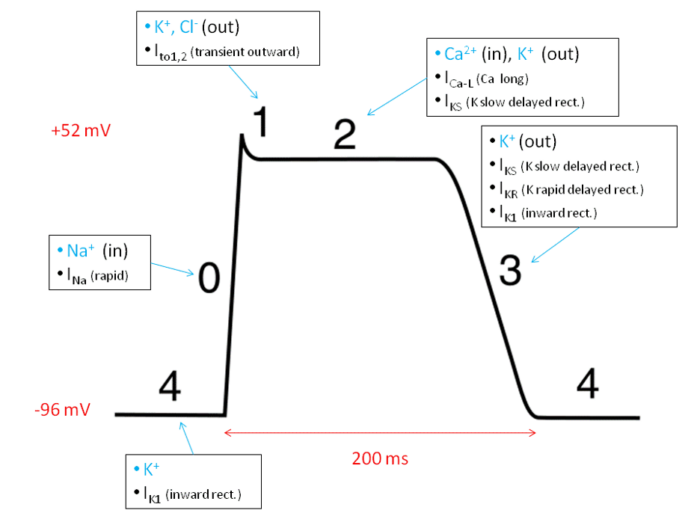
Figure 3. Action potential of ventricular myocytes. Wikimedia Commons. 2010. Accessed 11/27/2024. Link
Cardiac Cycle
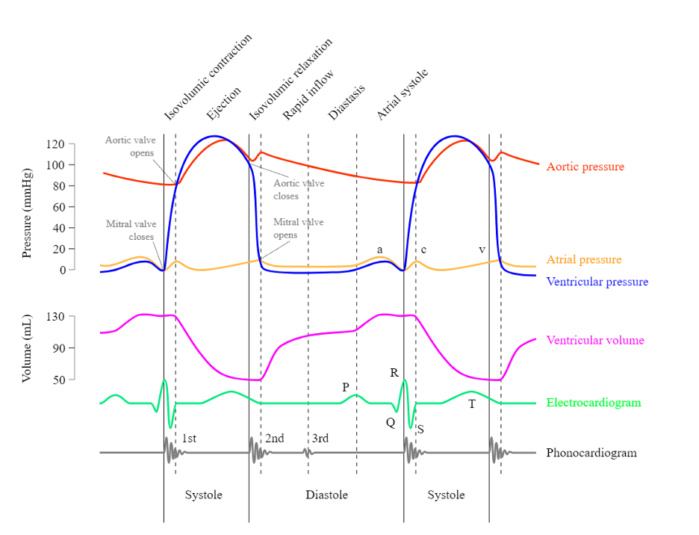
Phases of the Cardiac Cycle (Figure 4)
- Atrial systole: Contraction of the atria to push the last 20-30% of blood into the ventricles after relaxation, marked by the p-wave on the ECG.4
- Isovolumetric contraction: After the ventricles are adequately filled after atrial systole, the mitral/tricuspid valves close (S1 heart sound), and the ventricles depolarize, marked by the QRS complex. Ventricular contraction occurs, but no ejection of blood occurs due to continued closure of both the aortic/pulmonic valves and the mitral/tricuspid valves. Ventricular pressure greatly rises as a result.4
- Ejection: When ventricular pressures surpass aortic/pulmonary pressures, the aortic/pulmonic valves open, and blood is rapidly ejected from the ventricles to the pulmonic and systemic circulation. The end of this phase is also marked by the beginning of the t-wave on the ECG, which represents ventricular repolarization.4
- Isovolumetric relaxation: Ventricles begin to relax, causing a decrease in ventricular pressure. Once ventricular pressures are lower than the aortic/pulmonic pressures, the aortic/pulmonic valves close (S2 heart sound), and the ventricles continue to relax with no further change in volume.4
- Ventricular filling: When ventricular pressure falls below atrial pressure, the mitral valve opens, and the ventricles rapidly fill with blood (rapid ventricular filling). As the ventricles fill with blood, the rate of filling slows (diastole). The cardiac cycle then repeats with atrial systole.4
- Please see the OA summary on central venous pressure for descriptions of a, c, and v waves, as well as x and y descents. Link
Electrocardiogram
- Electrocardiogram (ECG) is one of the main diagnostic tools for measuring cardiac function.5
- While ECGs can have different lead placements, the standard is a 12-lead-ECG, with placements being seen in Figure 5 below.
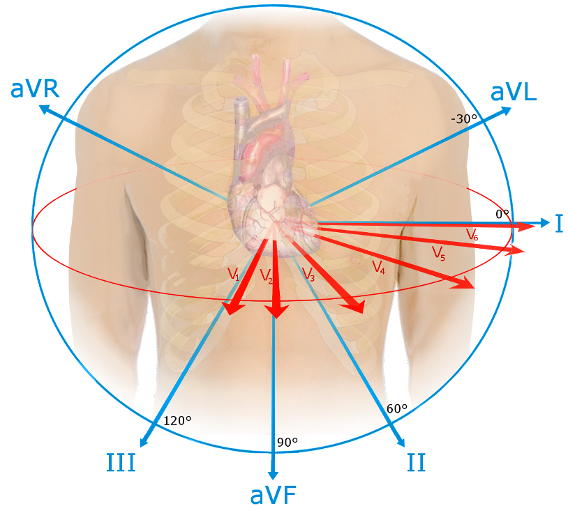
Figure 5. Spatial Orientation of ECG leads. Source: Npatchett, Wikimedia Commons. 2015. Accessed 11/29/2024. Link
- The standard leads involve six limb leads (I, II, III, aVL, aVR, aVF) and six precordial leads (V1-V6), which allow the identification of electrical activities via different angles and examine specific areas of heart function.6
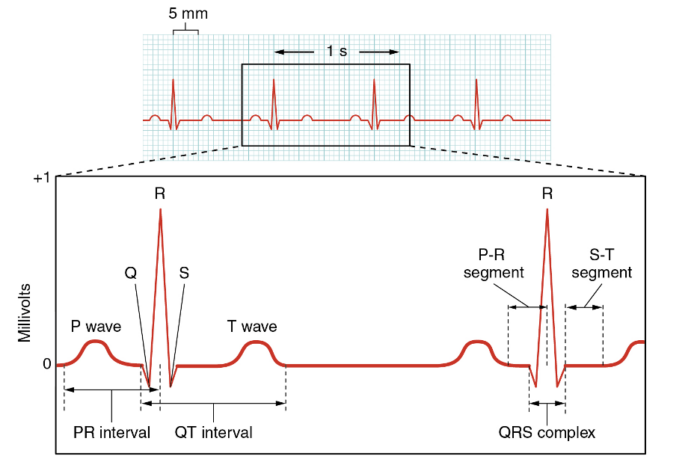
Normal ECG Parameters and Tracing (Figure 6)
- Heart Rate: This can be measured by counting the number of R waves in a normal 6-second ECG strip and multiplying them by 10, or by 300/number of large squares between two separate R waves. Typically, an adult’s heart rate is 60-100 beats per minute.6
- P-wave: The reference range is less than 120 milliseconds.6
- PR Interval: This is described as the time from the beginning of atrial depolarization to the beginning of ventricular depolarization. The normal range is 120 to 200 milliseconds.6
- QRS Complex: Ventricular depolarization. The normal range is up to 110 milliseconds.6
- QT Interval: This should be less than 440 milliseconds in men and 460 milliseconds in women. Often, the QT interval is corrected due to variations in heart rate and can be prolonged with the use of certain medications. Prolonged QT can predispose to a ventricular arrhythmia known as Torsades de Pointes.6
- ST Segment: This should generally be flat, with elevations or deviations being significant for ischemia, myocardial infarction, or other cardiac pathologies.6
- Axis: Direction of the average electrical vector (left or right) during ventricular depolarization and contraction. Can have left or right axis deviation, which is determined by polarity of leads I and aVF.6
- Normal axis: Both leads I and aVF have a positive (upward facing) QRS complex.6
- Left axis deviation: Lead I has a positive QRS complex, and aVF has a negative (downward facing) QRS complex.6
- Right axis deviation: Lead 1 has a negative QRS complex, while aVF has a positive QRS complex.6
References
- Klabunde RE. Cardiac electrophysiology: normal and ischemic ionic currents and the ECG. Adv Physiol Educ. 2017;41(1):29-37. PubMed
- Cardiovascular physiology & anesthesia. In: Butterworth IV JF, Mackey DC, Wasnick JD. eds. Morgan & Mikhail’s Clinical Anesthesiology, 7e. McGraw-Hill Education; 2022. Accessed 11/27/ 2024. Link
- Luo CH, Rudy Y. A model of the ventricular cardiac action potential. Depolarization, repolarization, and their interaction. Circ Res. 1991;68(6):1501-26. PubMed
- Waider W, Craige E. First heart sound and ejection sounds. Echocardiographic and phonocardiographic correlation with valvular events. Am J Cardiol. 1975;35(3):346-56. PubMed
- Sandau KE, Funk M, Auerbach A, et al. Update to practice standards for electrocardiographic monitoring in hospital settings: A scientific Ssatement From the American Heart Association. Circulation. 2017;136(19):e273-e344. PubMed
- Wagner GS, Macfarlane P, Wellens H, et al. AHA/ACCF/HRS recommendations for the standardization and interpretation of the electrocardiogram: part VI: acute ischemia/infarction: a scientific statement from the American Heart Association Electrocardiography and Arrhythmias Committee, Council on Clinical Cardiology; the American College of Cardiology Foundation; and the Heart Rhythm Society: endorsed by the International Society for Computerized Electrocardiology. Circulation. 2009;119(10): e262-e270. PubMed
Copyright Information

This work is licensed under a Creative Commons Attribution-NonCommercial-NoDerivatives 4.0 International License.
